Guide To SaaS Metrics for Customer Success

Customer Success, customer support, and product management all have their specific metrics and KPIs.
But in a CX-centric world in which we try to avoid silos structures and blame, every interaction along the customer journey has a direct or indirect impact on every metric which determines the health of your SaaS business.
Gone are the times when finance was responsible for tracking and improving financial metrics while marketing and sales were just concerned on their own KPIs.
With the advent of a 360-degree customer-centric business strategy, every single unit which is responsible for a touchpoint along the customer journey, can actively or passively affect distant metrics which belong to the domain of another business unit.
Every step in the chain adds value and create the overall customer experience. There’s no unit in charge of customer retention. Retention is a byproduct of the combined efforts that marketing, sales, business development, customer success, customer support, and product management put into the customer journey.
If you’re familiar with the butterfly effect, you know that at a macroscopic level everything seems to be interconnected, thus creating specific logic trends in a seemingly chaotic environment. This form of interconnection is way stronger and detectable at a microscopic level in which business units work together to create a cohesive customer experience.
We live in an interconnected, or rather a hyper-connected society. Organizations and markets “behave” like networks. This triggers chaotic (complex) rather than linear behavior. -Tom Breuer
A typical example of this might be showing how onboarding has a direct impact on retention or how customer success actually starts with initial interactions with prospects that occur outside of the website or product.
Table of Contents
The importance of monitoring and tracking company-wide metrics
Since we’re all interconnected in a CX-net that determines the success of our business operations, it is vital for separate units to have an overview of the entire dashboard.
Customer success and business growth are ultimately defined by how well communication and operations are integrated across the board.
Engineers, customer success managers, customer service and sales people all contribute to the entire customer experience which eventually leads to direct results on the bottom line.
The road to retention, customer success, and advocacy starts from the very first interaction with your brand and every minor adjustment in the approach of a single business unit can massively influence the overall output of the journey.
So, that’s why every department needs to keep an eye on all the SaaS metrics in a company’s dashboard: because each unit can virtually influence every single one of them.
And of course, tracking and measuring metrics is vital to steer the overall strategy of the company.
Data-driven decision making removes uncertainty and limits the number of experiments which need to be carried out in order to improve the KPIs. Every little pieces of information you can collect helps you define those measures which need to be put in place to steer successful operations.
The emergence of Big Data and analytics technology has had a tremendous impact on business strategy. We can now collect and analyze a huge amount of data to determine the effectiveness of our strategic decisions and the route we need to take to move ahead.
In the current business environment, information and data separate winners from losers, fast-movers from snoozers.
The key to success is connected to the metrics we track, how we manage to analyze and make sense of them, how we actually go from data analysis to creating an actionable plan.
How do you know how much paint you need to re-paint your living room without taking measures? How can you find the right present for your spouse if you don’t collect hints based on what they like?
Every decision starts with data and metrics. And making sense of past results while finding correlations with specific actions allows you to determine successful channels, strategies, and tactics that ultimately lead to better operational efficiency, higher revenue, and an overall great customer experience.

The Difference between Metrics and KPIs
Before digging into the specific customer care and product management metrics that need to be tracked, it’s important to clarify the difference between metrics, and key performance indicators (KPIs) to avoid any confusion.
Metrics are represented by quantitative data we collect at different stages of the customer and the company journey and which are useful to measure behavior.
KPIs are connected to targets and are set to measure performance.
In a way, KPIs are a subcategory of metrics which are connected to specific goals and linked to benchmarks for analysis. Metrics are generic measurements that can be used to make strategic decisions that influence KPIs.
There are plenty of metrics and KPIs SaaS companies track. All in all, the most salient metrics are exquisitely unique for each business because connected to its mission.
However, some generic metrics signal a healthy strategic approach to customer care and product management.
Such metrics can be subdivided into distinct categories:
- General business metrics
- Product Metrics
- Customer (customer success, customer service, customer support) metrics
Here a list of the key metrics that need to be monitored in a comprehensive SaaS dashboard.
Jump directly to:
- List of SaaS business metrics relevant for customer success and product managers
- List of Product usage and engagement metrics
- List of Customer related metrics
General SaaS business metrics connected to Customer Care and Product Management
MRR/ARR
Let’s start with the big picture. Monthly/annual recurring revenue is a straightforward metric that monitors the overall performance of the entire company. It’s not surprising that we’re going to start from this one.
In a sense, the most essential KPI for every unit is ultimately MRR/ARR.
Marketing might monitor the number of MQLs and the quality of the leads we generate, but ultimately this has an effect on the number of new customers and therefore, MRR.
Sales might monitor SQLs , conversions, renewals, and upsells but the overall effect of each metric is additional MRR.
The same holds true for customer success or product management. Retention, engagement, and referrals lead to higher LTV and advocacy, and ultimately to more recurring revenue. And so on…
MRR/ARR measure the predictable revenue stream that flows in through subscriptions and additional services.
This metric is only a snapshot of the revenue at a specific point in time. Even if it’s definition is simple, It’s hard to define performance and trends by looking at this metric, since it’s influenced by churn, upsell activities, and contraction.
Therefore, to define growth rate and performance it’s necessary to carry out churn waterfall and cohort projections to create specific reports on MRR momentum, Customer lifetime value, and MRR cohort analysis.
Due to this dynamic movements, it’s a slippery figure to use for account recognition and accounting in general.
In a subscription-based business model there might be delays between onboarding and subscription starts. That’s why SaaS companies also need to include CMRR (committed MRR) in their projections and why the overall picture becomes blurry and even more confusing for both attribution, and planning.
To calculate the MRR and monitor business momentum you need to take into account:
- MRR from renewals
- MRR from new acquisitions
- MRR from expansion
- Revenue Churn (from downgrades or customer churn)

As mentioned, though, this metrics can be quite deceiving since it only depicts the situation at a given point in time. Not all activities occur at the beginning or at the end of the month.
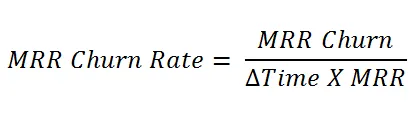
MRR Churn / Revenue Churn and MRR Churn Rate
SaaS MRR churn measures the erosion of MRR due to downgrading or customer churn.
Engagement and activation are directly connected to product and customer success metrics, therefore, this value is not only pertinent for sales but for the entire company.

MRR churn is directly connected to customer churn but also affected by customer behavior and engagement. It’s worth noticing that, even without taking into account downgrading effects, customer churn rate and MRR churn rate can be very different.
For example, if you have 1000 clients that contribute to a MRR of $200,000 and you lose 10 customers that contributed to $4,000 in MRR, your customer churn rate is 1% but your revenue churn rate is 2%. It all depends on customer segments based on the different pricing options you offer to your clients.
In general:
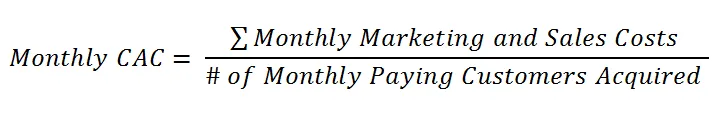
Customer Acquisition Cost (CAC)
Customer acquisition costs might seem to solely be related to sales and marketing at first. But the whole company can help reduce this value.
Referrals and customer advocacy are direct byproducts of an excellent product management and customer success strategy. Revenue generated through referrals dilutes marketing and sales acquisition costs.
This metric is defined as the sum of all marketing and sales costs that lead to a new customer acquisition.
Such costs include salaries, advertising costs, commissions, bonuses, and overheads associated with marketing and sales activities over a certain period of time (monthly, quarterly, or yearly, for example).
 Due to the dynamic movements explained in the section about MRR, it is more useful to normalize this value over a longer period of time, for example quarterly or yearly. This is especially important for SaaS companies that deal with long sales cycles that make it difficult to correlate marketing and sales activities with new acquisitions directly.
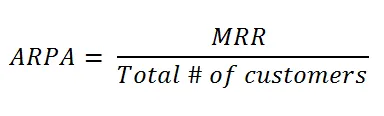
Average Revenue per Account (ARPA)
Based on the kind of account, the contract option they select, the billing cycle they go for, and the additional services they require different segments will have a different impact on MRR.
The average worth of a monthly contract with a customer is defined as ARPA.
In this case, again, the whole company is responsible for offering more value. Clients that commit to your solution and engage with your product and see and immediate ROI and achieve success are more likely to generate more revenue. That’s why the lead quality (customer segment) is only one of the factors that determine the ARPA. Product managers and customer success managers are equally involved in offering more value that actually makes sense for the customer, thus contribution to the shift in revenue.
Customer Retention Cost (CRC)
All the costs connected to customer retention over number of retained customers. Once a trial user becomes a customer, the focus shift to retaining them. If marketing and sales costs are included in the CAC, customer success and customer support costs all go into CRC.
These include all tools, materials and staff members that your company implements to engage and retain customers after they sign up their contract.
A good product design, together with educational content, guidance, and clear expectations have a direct impact on CRC.
Caveat: this value is often incorrectly calculated using the entire customer base at a particular point in time instead of using total number of RETAINED customers. This leads to wrong results.
The way we calculate CRC is as follows:
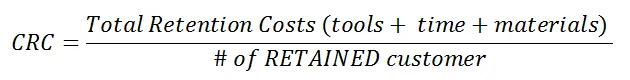
This can be calculated on a yearly or monthly basis.
Average retention costs should be lower than acquisition costs per definition.
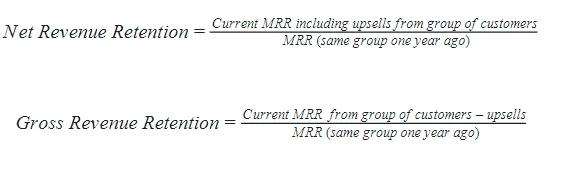
Revenue Retention Rate
This value measures the total amount of recurring revenue your organization retains over the period of observation.
It can be calculated as gross (without considering any lost revenue) or net (considering upsells and expansions).
The net revenue retention rate takes into account the efficacy of upselling programs on top of monitoring customer retention.
Again, as for every metric presented in this article, the ratio can be improved by combining the efforts of all units that deal with the product and customers.
Renewal Rate
Renewal rate is a complex topic which actually encapsulate several different concepts.
Generally speaking, Revenue Renewal Rate measures the percentage of renewable revenue added through renewals that occurred in a certain time frame.
In terms of Customer Renewal Rate that people consider is the number of customers who renewed their subscription in comparison customers who cancelled.
Some SaaS companies use a bookings number which derives from dividing the total number of actually renewed contracts by the number of contracts that could have been potentially renewed.
Finally, in strict financial terms, you can also consider the dollar value of renewal bookings divided by the dollar value of all renewing contracts.
In many SaaS companies Customer Success is responsible for renewals. But, as you can imagine, the overall level of satisfaction and the entire customer experience are internal factors that contribute to the rate of renewals. This, in turn, is connected to the approach that the entire company has with their clients from sales to support.
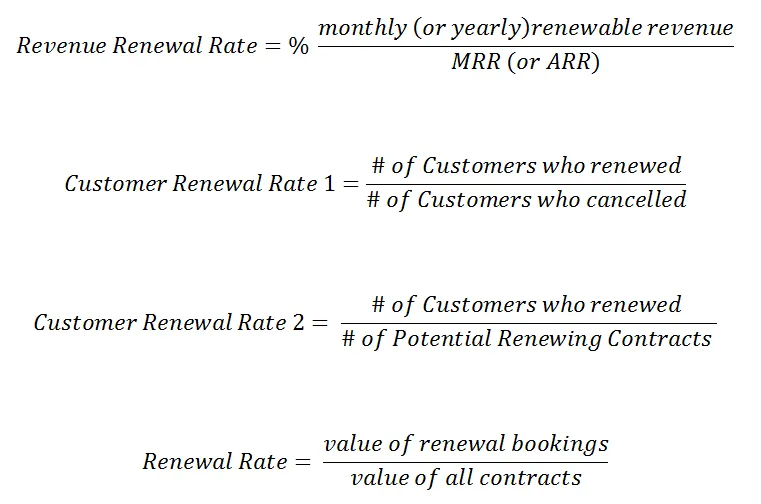
Quick Ratio
This Quick Ratio metric was created by Mamoon Hamid and measures growth efficiency of a SaaS company.
It basically pinpoints the overall efficacy of operations at each level of an organization from acquisition to retention by measuring revenue growth against revenue churned.
The higher the value the healthier the company.
Contraction (Downgrade)
The Contraction metric is the opposite of the expansion metric which takes into account the effectiveness of renewals and upsell carried out by sales and customer success.
Contraction refers to the loss in revenue caused by paying customers who decide to downgrade to a lower subscription plan or utilize a particular discount (maybe offered as an instrument of retention or reactivation).
In a sense, it is a subset of MRR churn which also derives from customers switching from a monthly to a yearly plan.
Expansion (upsell) Revenue
As mentioned in the paragraph above about contraction, expansion measures the amount of revenue generated through upsells.
these can occur when customers switch to a higher-paying plan or when they request additional services that your company offers.
Expansion revenue often balances lost revenue and creates a negative churn.
Reactivation Revenue
Reactivation measures the revenue generated through customer who had cancelled their subscription but were pulled back by customer success or sales.
Lifetime value (LTV)
Customer lifetime value is an estimate of the average gross revenue generated by a customer over the period of retention.
It is an essential metric that determines the capped value for CAC in order to break even and generate profit.
The basic LTV formula takes into account ARPA and churn rate:
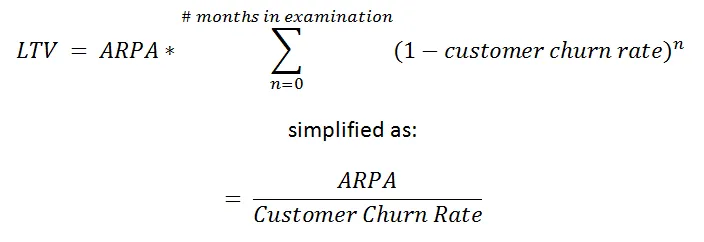
However, this basic formula doesn’t take into account that churn is not a linear value and doesn’t account for expansion and contraction. Therefore, it only represents a ballpark figure.
As mentioned, churn is not linear. The majority of churns occur during the first month and the rate levels off over time.
Considering different stages in churn rate we identify a characteristic pattern subdivided into: annual renewals, cliff, constant, and declining.
Adjusting the LTV formula to account for variance in churn rate over time (0.75 discount adjustment) and including the effect of expansion and contraction we obtain:

The last portion of the formula accounts for monthly changes in ARPA connected to expansion and contraction activities. If in your SaaS business model customers are not very likely to move to a higher or lower tier you can omit the last fraction.
You can use your LTV in combination with CAC to evaluate your business model.
In general we assume that your LTV/CAC ratio equals or is greater than 3. Otherwise you need to revise your CAC or increase LTV by focusing on your most profitable customer segments or increasing retention by improving customer success activities and product management.
Product Metrics
Active Users (DAU and MAU)
Daily and monthly active users (DAU and MAU) show how many people actually use your solution.
This provides an indication of engagement and activation. It’s not enough to win a customer. You want them to keep going back to your product because they actually see benefits from using it.
Dormant users are highly at risk of churn.
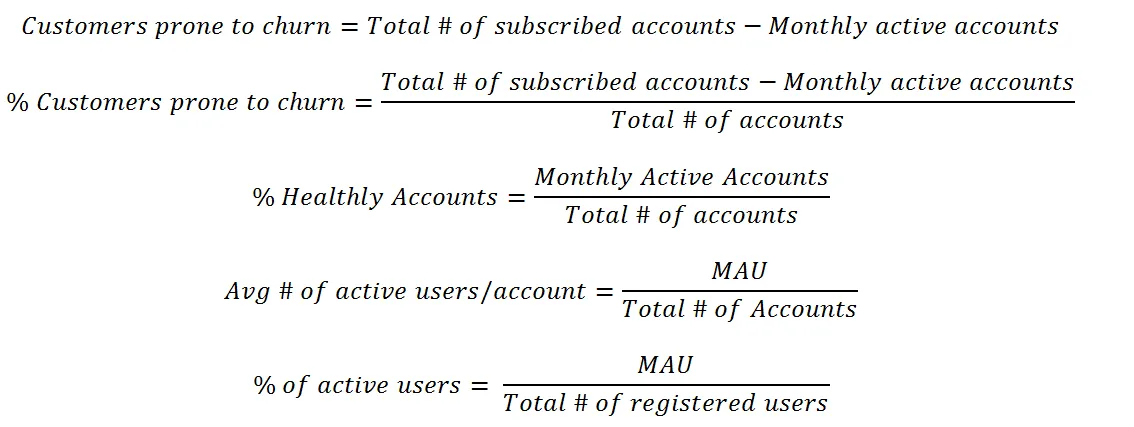
The goal of your product is to provide ongoing and continuous value to your customers. That’s why it is important to weigh this metric over number of subscribed customers and monitor its trend over time.
One of the most important things you need to establish first, is the exact definition of active customers. What defines active customer for your solution? Is it enough if your users log in to check messages or do they actually have to perform specific tasks?
Once the definition is clear you can monitor active users over time.
As mentioned, this measure of stickiness can also be used to define a number of customers who are prone to churn.
Notice that the definition here is a bit complicated as each account can have multiple users that work with your product. Each team member is a user. This can depict a wrong picture of accounts that are activated, as big teams will skew the result. On the other hand, companies might add all team members as users but then the product gets used by just a small group of them.
That’s why it might be useful to prompt customers to remove inactive users (as it happens with Facebook for Businesses for example) or perform different calculations for users and accounts.
You might also want to check number of active users per account since the more users work with a product in a certain organization the more internal champions you’ll have who will support your product and lead to higher retention.
From this we can derive interesting metrics:
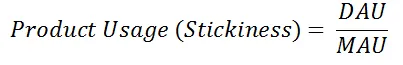
Product Usage – Stickiness
Using MAU and DAU we can calculate product usage, which determines the level of engagement customers show within your solution and is calculated as the ratio between daily and monthly active users.
Number of Sessions per User
This metric is very useful to start looking into customer engagement and activation. This behavior metric tracks how often each specific customer logs in or accesses your product.
This gives an indication of how committed users are with your solution and how healthy they are.
Additionally, you can see how deeply integrated within their business ecosystem your solution actually is and how much they profit from it.
Product features and clear ROI goals and expectations set by customer success have a huge impact on this figure.
To calculate the average of this value, it is a good idea to avoid using means by removing outliers (highest and lower values) that might skew the result and take the median value.
![]()
Sessions per day (Activation)
Some businesses measure activation in sessions per day. This metric evaluates habit formation and how well a specific solution is integrated in the daily routine.
Sometimes the metric is connected to the actual value that a product offers as in the case of CRM solutions or project management tools.
Other times, it only infers some form of addiction as it happens for some social media or gaming applications.
In any case, this value offer a precious insight into how often users interact with your product.
Time Spent in the Product
Another standard indicator of engagement is the time people spend in your platform.
This value can have two sides. If the value customers receive is directly proportional to the time they spend in your software, then it’s a positive indicator of engagement.
If your core value is based on accessibility, usability, and speed, then this metric can signify that something is not going according to plans.
An easy example is Google. They spent years in trying to reduce the time users spend in their search engine (but profit from number of recurring sessions of course!). The same might hold true for an automation software, a design app, or any editing software that promises to be the fastest solution.
Customers might be stuck at different stages and might have a hard time accomplishing tasks. In this case, you might need to monitor behavior and re.think your UX.
Session Duration / Cohort
It is important to monitor the average duration of a session for each customer segment. Also in this case, as explained in the paragraph about number of sessions per user, it is better to use median values instead of means.
By comparing the session duration between churned and retained customers you can have a pretty good indication of what product, onboarding and customer success measures you might need to implement in order to increase engagement and activation.
![]()
Onboarding Engagement
Churn is directly linked to onboarding.
Leading users to fully understand your product and its features quickly achieve results is the key to creating a long-lasting relationship with your customers.
That’s why it is essential to monitor and improve engagement during the onboarding phase.
The sooner users interact with your product and the more engaged they are, the more they’ll feel compelled to continue using it.
Activation and retention are deeply rooted in the onboarding process.
Onboarding is the most crucial step in the road to customer retention. As such, it is important to trace and carefully look at engagement indicators that might signal problems during this phase.
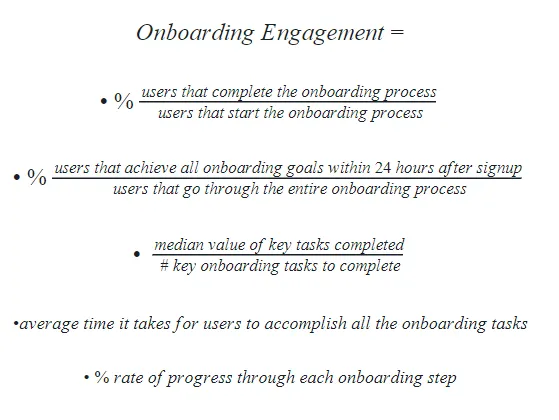
Engagement during onboarding can be calculated by looking at a checklist of necessary tasks that need to be completed to start using a product efficiently and measuring how often and how fast users go through the entire checklist.
Customers who go through all the most important onboarding steps within 24 hours are 80% more likely to convert (according to a study conducted by Groove).
Product managers, and UX designers need to have a clear overview of micro and macro goals that users need to achieve. Users need to be provided with a checklist in which they can tick off goals and be rewarded for it. This way you can guarantee feature adoption and activation.
Userlane offers such a checklist in combination with on-screen interactive guides that steer users through onboarding process in real time to make sure that the process is as fast and as effective as possible.
There are several ways to calculate onboarding engagement.
With our analytics, you can visualize such metrics to identify areas that require your attention so that you can adjust your UX and your onboarding process accordingly.
Number of Key User Actions per Session
This can be considered a vital KPI for product and customer success.
You can start by identifying key actions that users need to take in your software and track them over time for different customer segments.
For a software solution like Autopilot, for example, such an action could be number of journeys created, and for Facebook this could simply be number of ads published or edited.
Again, looking into the difference in this value between churned and retained customers, you can see how you can promote engagement in order to reduce churn.
It’s also important to monitor this value over time and compare results to see how engagement fluctuates over time for different customer segments.
![]()
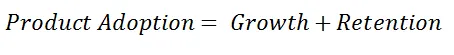
Product Adoption
Product Adoption refers to the combined effort of successfully onboarding new users while retaining existing customers.
It’s an absolute value that merges growth and retention.
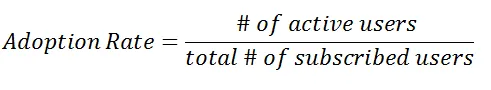
Rate of Adoption
Once you define key indicators that point at active users, you can take the number of active users over the total number of subscribed users to determine your adoption rate.
I presented this metric in the section about number of active users using the term ‘% of healthy users’ since this metrics is both connected to product (as adoption rate) and customer success in terms of customer health score (see below).
User Engagement Metrics
You first need to define behavioral patterns which are connected to the outcomes of your solution and to the key features you offer.
Generally speaking, active users, average session duration, and number of key actions already provide a pretty good framework to assess engagement.
Additionally, you can introduce other metrics which define user engagement and retention over time:
D1, D7, D30, W1 Retentions
These values indicate the percentage of users who are active after one, seven and 30 days after signing up.
These values can be represented in a waterfall cohort analysis form or through a retention curve.
In particular, W1 retention is an essential metric that you need to optimize to increase customer retention. The majority of users churn during the first week after sign up.
Improving retention over this critical period with proper onboarding and activation has a durable effect on the entire retention curve.
Identifying customers who don’t engage with your product at an early age and setting specific triggers connected to an action plan (tailored offers, one-on-one strategy sessions, customer support calls) can lead to a much higher number of conversions and active users.
Time to Value
That’s an onboarding metric which truly defines the success of your business.
It measures the time it takes for a customer from signup to first results and that famous “aha moment”.
Any minute of delay between signup and quick wins increases the chance that a customer simply drops off during the onboarding phase to most certainly never return back.
To improve this metric is necessary to optimize your user onboarding process and offer guidance to quickly lead users to achieve their goals.
![]()
Feature Adoption
This metric is a quick primer for customer success and product management teams.
Every time a new feature is introduced (maybe following a feature request) the product team is obviously excited and would love customers to promptly try it out.
With increasing competition in the SaaS market, product innovation is essential. Therefore, feature announcements and feature adoption become important to make sure that your customers follow the developments in your product roadmap.
Feature adoption during onboarding and in subsequent stages is linked to the realization of how valuable your product is and therefore, is a mission critical step toward customer retention.
Feature adoption in itself only measures the efficacy of your feature promotion (think of emails, popups, red counters next to a bell, incoming messages, or flashing gift packages).
Knowing that over 40% of your users adopted a new feature over the course of the first week after roll out means little to nothing.

The real added value of feature adoption lies in how many customers tested your new feature initially and continued to use it over time. If your users never actually use a particular feature after testing it when it was launched, your feature adoption level is still low, independently from how many customers were enticed by your announcement.
A thorough feature adoption analysis takes into account the depth of adoption, the time for adoption, and the duration of adoption.
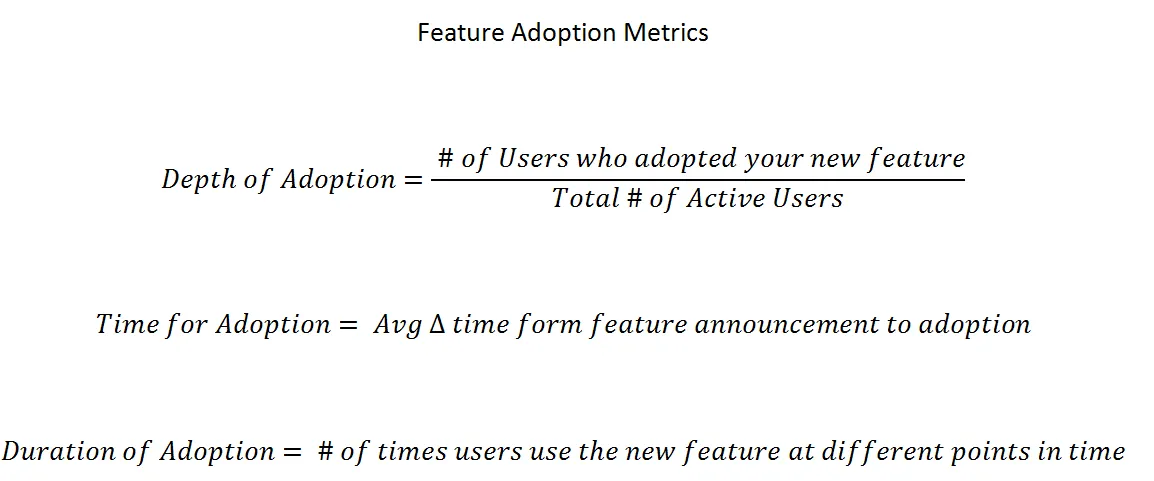
Such indicators can be tracked for different customer segments especially is the feature was developed for a specific target group.
General Feature Usage Metrics
To evaluate the solidity of your customer persona research, product-market fit, product roadmap, and product marketing strategy you need to identify basic measures connected to feature usage and feature usage per customer segment.
Following an MCI analysis (see customer metrics below) and collecting feature requests you can introduce new functionalities without relying on assumptions.
Initially, though, you can only rely on market research and business development to prioritize projects in your roadmap.
Feature Usage metrics evaluate the validity of your assumptions and of the research data you collected.
Particularly it is interesting to know:
- How often a particular feature is used
- What sets of features tend to be used by what user segment
- What feature generate confusion or frustration
- How much time users spend with a particular feature in comparison to total time spent in the product
- What user segments seem to be indifferent to the feature
- Feature adoption (see paragraph above)
- Temporal trends that might show a distinct pattern
Customer Count Retention
5% increase in customer retention can increase a company’s profitability by 75% – Bain and Co.
Exactly as churn hinders growth, its opposite, customer retention, is the strongest growth engine for SaaS companies.
Customer retention rate in itself is less actionable as a metric in comparison to churn rate but it’s necessary to monitor it to evaluate the overall health of a company.
Customer count retention is defined as number of customers which were active in the previous year over the same number at the date of data collection. Therefore, the metric is directly linked to gross retention revenue (covered in the previous section about business metrics).

Customer Success and Customer Care Metrics
Customer Churn and Churn Rate
Customer churn is the most essential metric for SaaS companies that want to thrive.
As mentioned more than once, business growth is only sustainable if based on customer retention. due to a worrisome increase in CAC in the sector, now more than ever, retention represents the basis for a healthy and steady growth.
The absolute number of customers that abandon your product over a certain period of time represents the customer churn value.
Churn can occur actively (when customers cancel a subscription) or passively (expired credit card, failed renewal) and can be reversed with win-back re-activations.
Based on these definitions, the average net monthly churn can be calculated as follows:

This calculation can also be carried out for longer periods of time such as quarterly or yearly.
The whole customer churn concept is way more complicated than this and we’ll soon dedicate a specific post to the topic. Plus, the way you calculate it is not strictly universal as, if you take into account segmentation and other factors there apparently are 43 different ways to calculate churn.
Measuring the number of churned customers in a certain period over the number of customers at the beginning of that period gives us a value of our churn rate for that period.
Simply put, if you have 100 customers at the beginning of the month and five of them cancel their contract, your churn rate equals 5%.
This figure has a dramatic effect on growth. It slows down the pace at which your company scales and such a high churn rate nullifies all marketing and sales efforts and hinders your company from recovering acquisition costs.
Churn rate needs to be differentiated for monthly and yearly contracts. Yearly contracts must be removed from the calculation because they skew the result and create a rosier picture than it actually is. Yearly subscribers don’t churn simply because they can’t.
Responsibility for churn starts with overpromising marketing and sales claims, a bad UX during the onboarding process, and continues with bad product management, customer success management, and customer support.
Every unit can support the business reduce its churn rate.
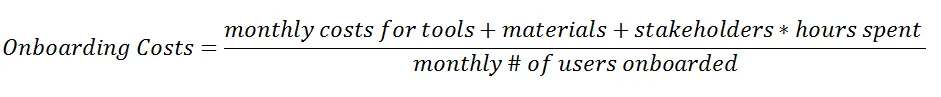
Customer Onboarding Costs
These costs include time and expenditures connected to your onboarding operations.
Such costs might be connected to onboarding software, your email automation software (for onboarding emails), people involved in calls or webinars, webinar technology, costs connected to producing and maintaining (updating) product documentation and educational content, costs connected to technology used to create such a knowledge base, strategy calls, and so on based on how high touch your user onboarding process is.
All in all, such costs are a subcategory of acquisition costs. However, your company incurs such costs after generating an SQL. In this case, this metric belongs to the domain of product and customer success.
In order to scale the process you need to automate and simplify onboarding as much as possible to reduce costs and limit the number of people involved.
Net Promoter Score (NPS)
A simple way to gauge customer success is asking users how likely they would recommend your product to other prospects.
The answer that customer can give goes from 0 (not likely at all) to 10 (extremely likely) and is a good encompassing indicator of how satisfied a customer us with you product and customer success program.
Based on their score, customers are subdivided into three categories:
- 0-6=Detractors
- 7-8=Neutral
- 9-10=Promoters
To evaluate the aggregate effect of customer success (and of the entire CX with your brand) on net promotion, you have to consider potential advocates and subtract detractors:
![]()
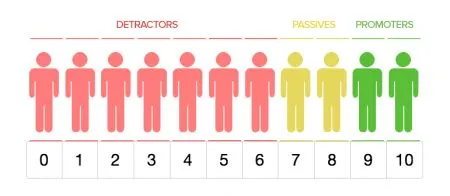
Image Source: QuestionPro
Advocacy (Viral Coefficient)
This metric is directly connected to the NPS.
While the net promoter score shows the potential number of promoters and the level of satisfaction among users, the viral coefficient measures referrals.
Basically, the value indicates how many new customers you can expect to acquire through referrals of each existing customer.
Some of the top SaaS companies mention referrals as their main source of leads. Through their customer success and referral programs, and a great product roadmap, such companies can generate an army of evangelists that support growth.
In a sense, the target of each company should be generating advocates if you think about it. We all love to promote and recommend products or services we are satisfied with, because it makes us look knowledgeable and smart among our peers.
Hence, a product that offers real value to their customers and a customer care program that meticulously work toward the goals of each single one of them automatically creates referrals.
And, as mentioned, referrals are connected to retention since leads generated in this way are more likely to become loyal customers and such a growth engine dramatically reduces CAC.
Such coefficient of advocacy is defined as viral since it possesses intrinsic exponential characteristics that might allow your business to spread like fire!
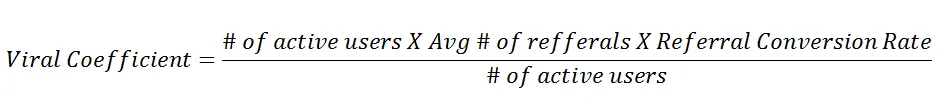
A viral coefficient of 0 means that none of your clients brings in your customers. With a conversion rate of 20%, a viral coefficient of 1 means that, in average, each customers recommend your business to 5 friends or colleagues.
Customer Effort Score (CES)
There are specific frustration points your customers might encounter along the journey.
Such touchpoints are detrimental and can increase the risk of churn.
These events need to be monitored and you need to a) reduce the time a user deals with inefficiencies or non-value-adding processes b) Connect such events with triggers that allow you to intervene as fast as possible with live messages or emails that might prevent the user to contact support or, in most cases, give up.
The time customers spend dealing with inefficiencies is to be considered a warning signal for potential churn.
UX designers, customer success agents, and product managers can all work together to reduce the efforts connected to specific customer events that take place within your software.
In order to monitor your CES you can use survey technologies such as CheckMarket that allows you to monitor efforts in real time and create reports to visualize performance and automatically receive notifications to trigger action.
The adaptation of the CES for planning purposes is defined as:
Net Easy Score
Image Source: i-Scoop
Customer Health Score
This score can be linked to usage statistics (see ‘number of active users’) or can be linked to particular engagement metrics or specific goal-oriented objectives characteristic of your product.
Every engagement and activation indicator can contribute to the overall customer health score.
Automation and customer success solutions allow you to collect granular data which go way beyond the old fashioned traffic light system companies used to adopt in the past.
This score not only takes into account product usage metrics but also sticky feature adoption, depth of usage (how many features users basically adopt), account growth and expansion, duration of the contract, renewal cycles, upsells, additional services the customer uses, support calls, sentiment and participation in marketing activities (such as referrals, testimonials, case studies), billing history, segmentation.
Some factors that contribute to the overall health score are numerical and easy to extrapolate.
Other factors are purely subjective and can be collected through quarterly reviews.
The score can go from 0 to 100. You need to set specific thresholds that must trigger immediate intervention once you see that a customer health score decreases for whatever reason.
The score can predict churns and renewals but it’s important to assign a proper weight to each contributing factor in order to plan actions based on the overall health of your customer.
Customer Engagement
The frequency of interaction between a customer and a customer success team through different channels and platforms.
![]()
Customer Pulse
This is actually not a real metric. Subjective and personal feedback collected by customer success agents in reports.
This evaluation can occur in quarterly reviews, check-in calls, and through surveys.
Sentiment Analysis (Mentions, VOC, social listening and monitoring)
You can gather CES, NPS, and CSAT data directly on your premises. But to measure the overall impression you make on your customers it is also worth investing time in monitoring social media, blogs, review sites, and forums and carry out a sentiment analysis through voice of the customer (VOC) tools and programs.
Trial-to-Paid Conversion Rate
This value indicates how efficient your onboarding process is while hinting at potential problems linked to product management, UX Design, communication (with marketing and sales), and expectations set by customer success.
In a way, this is an overarching metric that evaluates how efficiently your company works from selecting the right leads that are likely to convert, guiding them through the onboarding phase, taking care of them and turning them into loyal customers.
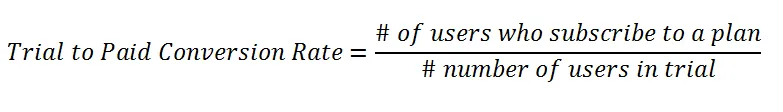
This value can be monitored separately for different customer segments in order to steer marketing targeting activities to address those customer segments that have a higher conversion rate.
Customer Adoption
Generally speaking, adoption is everything that happens after the onboarding phase and the first renewal.
In this case, customer adoption metrics are to be found within product engagement, activation, and retention metrics described in the product metrics section.
Customer adoption is a higher-level measure that allows you to map the entire customer lifecycle.
The ultimate indicator of adoption is ROI and delivering on the promises you made when onboarding your customer. You might have an internal champion at a client’s but eventually, every tool goes through validation and ROI calculation to skip the veto of other stakeholders which are responsible for the budget invested in your solution.
An essential component that needs to be considered in feature adoption is the alignment or renewal cycles and adoption cycles. If these don’t align organically (which seldom happens) you need to be willing to extend the adoption period in some way before approaching the customer for a renewal just to find out that they still don’t perceive the real value of your product.
Customer Support Metrics
We can conclude our discussion on essential customer and product metrics for Saas businesses with a quick overview of some basic customer support metrics.
Time to first Response
This time value indicates how long it takes to get in touch with a customer the first time they contact support.
Why just the first time?
Because the first impression counts. Imagine you deal with customer support for the first time it takes days before receiving a reply. this would create a permanent dent in the relationship with the brand that would characterize all future interactions.
Thanks to automation and AI we now can rely on systems that dramatically decrease time to first response.
Instead of sending an auto-reply message that says “We’ll soon get back to you” we can now conversational bots and automatic ticket management systems that can immediately deal with easy queries.
Reply time
While time to first response monitors the interval of time that occurs between first query and response, reply time traces a more generic value that points at the efficiency of your customer support processes.
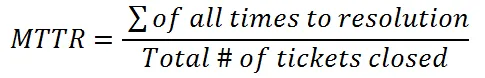
Mean Time to Resolution (MTTR)
This metric calculates the average amount of time that it takes for support agents to close a ticket after a support request.
Depending on whether or not you have international clients and a customer support team that can cover different time zones 24/7 you might take into account only normal business hours when calculating the actual time to resolution.
This value is tied to customer satisfaction and is inversely proportional to it.
Customer satisfaction (CSAT)
Happy customers are not just those who never experience any problems.
Happy customers are also customers who encounter issues but feel that they’re properly supported along their journey. This sense of dependability and trust you create in your customers is essential when it comes to customer success, retention, and advocacy.
The CSAT value measures how satisfied customers were with how quickly you responded to their query and how happy they are with the response they received.
Such value can be collected directly with a survey you present after managing a support query and can be based on a simple YES/NO direct question or include multiple questions to assess your level of customer support.
Such index can be used in general to measure how customers perceive any interaction they have with your company (from live chats, to ticket support, or with your knowledge base).
Help Center Article Rating
I’m pretty sure you’re familiar with this one as you’re often requested to rate support articles on basically every major service, from Google to Facebook and co.
By asking how useful a certain article is you can define how accurate your search is (to direct people to relevant support articles in your database) and how thorough and up to date your articles are.
This metric is the CSAT for your knowledge base and is particularly important since the vast majority of customers prefer to have access to self-service support which is the most instantaneous form of reactive support provided that it is accurate and pertinent.
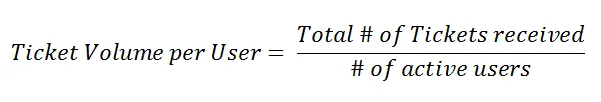
Ticket Deflection / Ticket Volume per User
This simple absolute value traces the number of tickets a user submits and its fluctuation over time.
The ticket volume per user is calculated on the basis of number of tickets over number of active users.
Since most of the queries revolve around the product and its features, ticket deflection is best if it occurs within the application itself.
Investing in a thorough knowledge base is always worth the money, since ticket deflection can save lots of costs. However, it is a good idea to offer in-app guidance to avoid distraction and frustration which derives from abandoning the working platform to look for help.
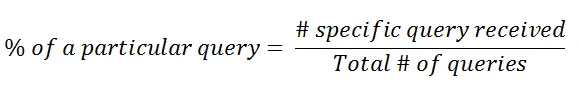
Most Common Issue (MCI)
Every customer query is usually tagged with a specific label:
- Bug Report
- Feature Request
- UX Issue
- Billing Issue
- ….
By defining what issue is reported most commonly by your users you can steer your product roadmap and prioritize projects based on statistics.
Final Remarks on Customer and Product Metrics
As you can see it’s easy to get lost in the ocean of customer care and product metrics.
The idea is that not all metrics might be relevant to you. You need to focus on those metrics that actually facilitate your decision making processes.
Some figures might simply be interesting from a statistical point of view, others might just be vanity metrics.
Focus on those metrics that matter and are related to your business model.
Plus, as mentioned at the beginning, you need to separate metrics from KPIs and monitor performance based on a set of key indicators that are actually connected to your business goals.
A few indicators can already show if you’re on the right way but when things seem not to work, each single metric you collect can help you identify troublesome areas that require more attention.
The end result must be a steady, sustainable growth rate. If this doesn’t happen you have to spot the stage at which your business loses customers so that you can adjust your strategy accordingly.
Your best friends, in this case, are all the important metrics that you can collect along the way thanks to great technology and tools and your direct interaction with your customers.
TL;DR
Start collecting metrics now and base your product and customer strategies on the most important indicators that relate to your business goals.