
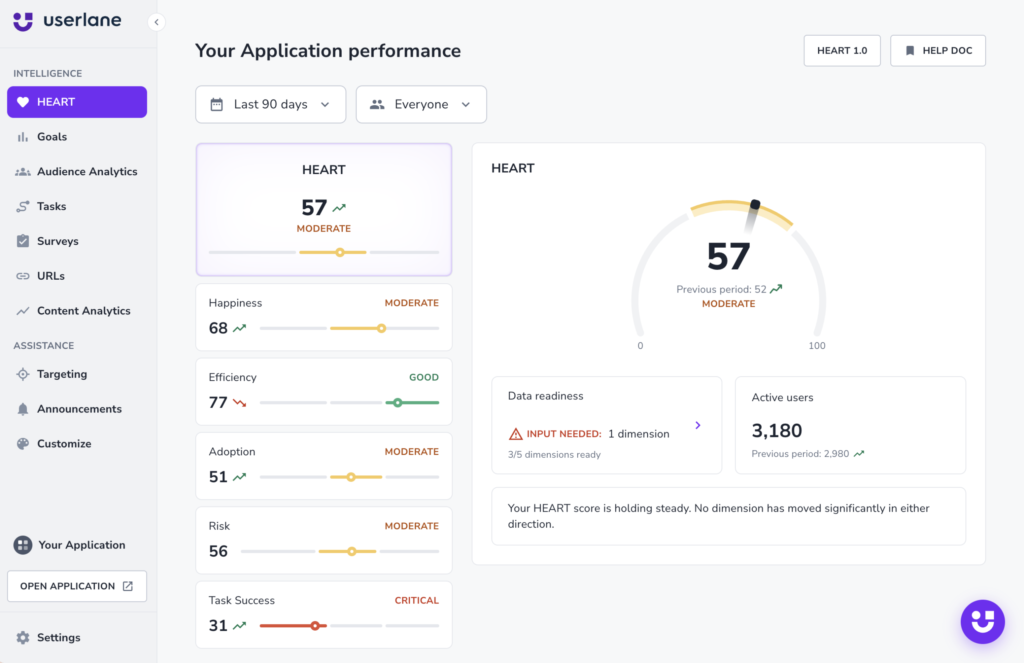
How Userlane measures whether an application is delivering what it was bought for, and how to read the result
Every application in the portfolio carries a cost. Whether any of them are earning that cost is a question the standard data was not designed to answer, because it measures activity, not outcomes.
Login counts show who opened the application, not who completed a process. Training completion shows who sat through the course, not who is faster three months later. The annual satisfaction survey shows how people feel, not what they do. Each captures a slice. None captures whether the application is earning its place. The result is a room full of people debating what “good adoption” means when the renewal comes up.
The HEART Score replaces that debate with a single number per application, built from five dimensions that connect usage to business outcomes. The score sits inside Userlane’s Application Intelligence product. When a dimension scores low, Userlane’s Contextual Assistance product acts on that signal inside the application. The score then reflects whether the action worked. Measure, act, prove: that loop is what makes this an operating model rather than a dashboard.
What the HEART Score measures
Happiness measures user satisfaction through a standardized CSAT survey (fixed question, fixed scale, fixed quarterly cycle). The survey is identical across applications, so scores are comparable across the portfolio. Low satisfaction often signals resistance to the next rollout, which shows up as delayed timelines and more change management cost.
Efficiency measures whether users complete tasks faster over time and reach proficiency. Rollout business cases assume staff reach proficiency shortly after training, and Efficiency shows where that assumption breaks. Where proficiency stalls, the organization pays in extended ramp time and higher support volume. The productivity gains the business case promised take longer to arrive. Requires Tasks configured in Userlane.
Adoption measures how much of the licensed user base actually uses the application and whether that usage holds. Three signals feed it: what share of licensed users are active, whether their usage goes beyond logging in, and whether they return. Users who go inactive still cost a seat.
Risk measures whether data compliance rules are followed and whether processes run as designed. An incorrect field entry can surface months later as a reporting error or an audit finding. A skipped process step can produce the same result. The longer either goes unnoticed, the more expensive it is to fix. Requires Validators configured in Userlane.
Task Success measures whether users complete their workflows. The score is an aggregate completion ratio: total completions divided by total starts, weighted by actual usage volume. When users abandon a workflow, the work typically moves to workarounds, manual processes, or someone else’s time. Requires Tasks configured in Userlane.
How to read the number
The HEART Score combines all five dimensions into a single number from 0 to 100. The weights are fixed across customers and applications. Reference values differ by application category: a CRM and an HRM are not used the same way, and the scoring accounts for that through category models and research.
A score around 50 is typical for the application’s category. Scores above 75 need no action, while scores below 25 need attention. The score reflects where the application stands, not where Userlane thinks it should be.
Because the scoring method is consistent, you can compare scores across the portfolio, including browser-based AI tools. Thirty applications in a budget meeting, one column of numbers, telling you whether each application is earning its place. When one is not, the next question is what to do about it.
From measurement to action
A low Adoption score points to a coverage problem. If Risk is scoring low, data compliance or process consistency is breaking down somewhere. The score names the dimension, and Contextual Assistance provides the tools to respond.
In practice, that means an admin configures a targeted intervention. A guide can reach users who are not active. A validator can catch data entry errors at the point of entry. The assistant can help users complete a workflow they abandoned. The response matches the dimension.
The score then reflects the outcome. Deploy a targeted guide and Adoption might move from 40 to 60. Configure a validator and data entry errors drop. The person presenting at the budget review can show what changed, why it changed, and what the number looked like before and after. That evidence is what the next conversation runs on.
What this changes
That evidence looks the same regardless of who reads it, and until now, that has been rare. IT sees usage patterns in one report, finance sees the cost line in another, and compliance tracks risk exposure in a third, each describing the same applications differently. The HEART Score puts all three on a shared number. That number trends over time and connects to the actions that moved it.
Related reading
Beyond completion rates: what software adoption metrics actually tell you
What is Application Intelligence
Why AI ROI calculations miss the mark: license vs actual use

