
Organizations celebrate go-live dates. The productivity dip that follows gets a fraction of the attention, and almost none of the measurement.
The gap nobody measures
According to McKinsey, 89% of large companies globally have a digital and AI transformation underway. Yet on average, those companies have captured only 31% of expected revenue lift and 25% of expected cost savings from those investments.
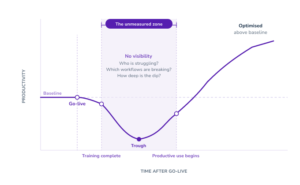
The software shipped, training was delivered, and the project team closed the workstream. The shortfall sits in what happens next: a period after go-live when employees are expected to be productive with tools they have barely learned. Researchers call it the shakedown phase, a well-documented productivity dip first described in operations management literature more than two decades ago and consistently replicated since.
Time to proficiency (the elapsed time from go-live to independent, productive use) is the metric that captures this gap. And it is the metric that almost no organization tracks.
Deployment is not adoption
The assumption baked into most enterprise rollouts is that deployment equals readiness. Project milestones track go-live dates, user provisioning, and training completion. Then the project closes. However, the data tells a different story:
- Only 18% of B2B companies set explicit onboarding and adoption goals with customers at the outset (McKinsey, 2025).
- PwC’s 2026 Digital Trends survey found that 89% of operations executives say their tech investments haven’t fully delivered expected results, with integration complexity, data quality issues, and user adoption challenges the most frequently cited reasons.
- Only 58% of talent development professionals think they effectively measure learning, even though more than 90% include assessments in their training (ATD, 2024).
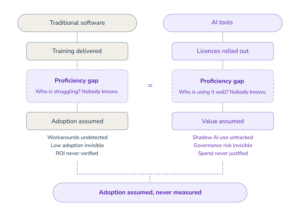
Organizations measure whether people attended training, not whether the training did its job. Completion rates stand in for competence. The gap between the two is where value disappears.
What happens in the gap
When employees cannot complete tasks efficiently in new software, they build workarounds. A peer-reviewed field study published in Organization Studies (2026) followed a digital platform rollout over 18 months and found that frontline employees reverted to old routines after constructing workarounds for symbolic compliance. The escalation pattern matters: workarounds for low-stakes tasks fuelled motivation to build workarounds for more complex, labour-intensive activities.
This behaviour is a rational adaptation to inadequate support, not employee resistance. Research in the International Journal of Information Management (Wong et al., 2022) links workaround behaviour directly to inadequate information systems and corporate policy rather than to employee attitudes.
Gartner’s 2024 Digital Worker Survey reinforces the scale: only 23% of digital workers are completely satisfied with their work applications, down from 30% in 2022. Nearly half struggle to find the information they need to do their jobs effectively.
The cost is concrete: these workarounds introduce compliance risk, data quality problems, and duplicated effort across every department that touches the new system.
The AI amplifier
If the proficiency gap was expensive with traditional enterprise software, AI is compounding it. McKinsey’s State of Organizations 2026 report (surveying more than 10,000 senior executives across 15 countries) found that 88% of organizations are experimenting with AI, yet 81% report no meaningful bottom-line gains. Only 1% of C-suite respondents describe their generative AI rollouts as mature.
Gartner’s 2026 data on AI in infrastructure and operations sharpens the picture: only 28% of AI use cases fully succeed or meet ROI expectations. Among the 77% of I&O leaders who reported at least one successful use case, the primary success factor was integrating AI into existing workflows and systems rather than deploying it as standalone capability.
Technology deployed without measuring whether people can actually use it in their work produces the same productivity dip, whether the technology is an ERP system or an AI copilot.
What to measure instead
The fix starts with measuring the right thing. Time to proficiency connects the investment decision to the business outcome because it captures what sits between deployment and value realisation: the elapsed time from go-live to productive, independent use.
- Task completion, not training completion. Can employees finish the workflows they need without help, workarounds, or errors? Measuring this requires visibility into how applications are actually being used post-deployment.
- Cohort benchmarking. Comparing proficiency curves across departments, sites, or roles exposes where support is working and where it is failing. Aggregate averages hide the variation that matters.
- Adoption scoring over satisfaction surveys. Multi-dimension adoption measurement (combining engagement, task success, and retention data) gives a continuously updated picture rather than a point-in-time snapshot.
Here is an example. An organization rolls out a new compliance workflow across 2,000 users. To keep adoption on track after go-live, Userlane’s Application Intelligence monitors how employees are actually using the workflow, flagging where they get stuck, drop off, or build workarounds. When HEART Analytics shows that one team is consistently failing at a specific step, Contextual Assistance delivers in-app guidance right at that step, so employees get help in the moment rather than after the fact. The result: the proficiency gap shrinks, time to productive use drops, and the organization has the data to prove it.
The bottom line
The post-go-live productivity dip has been documented in operations research for more than 20 years. What has changed is the scale (every organization is now running simultaneous software and AI rollouts) and the availability of tools that can measure proficiency continuously rather than relying on training completion as a proxy.
Time to proficiency is the metric that connects your software investment to its intended outcome. If you are not measuring it, you are managing adoption by assumption.
Read more about software and AI proficiency:
Shadow AI: how to see which AI tools your teams actually use

