
Aligning department goals in healthcare settings
Drive Change & Engagement

Goals Challenge
Department goal alignment in healthcare depends on consistent application use across the organization. Most health systems have no way to see whether the software behind those goals is being used correctly.
A health system sets targets at the organizational level: reduce medication errors by 15%, cut discharge documentation time by 20%, improve nursing assessment completion to 95%. Each target depends on staff completing workflows correctly in the applications that support them. The Electronic Health Record (EHR) handles medication documentation. The HRIS manages credentialing and timekeeping. The ERP processes requisitions and budget entries. Each application has its own adoption rate, its own training gap, and its own set of departments where usage falls short.
The visibility gap follows a predictable pattern. The Chief Nursing Officer sets a medication safety target but cannot see that two wards document inconsistently in the EHR. The Chief Financial Officer approves a procurement goal but has no data showing that three departments bypass the ERP requisition workflow. When a goal is missed, no one can trace the gap back to the specific workflow, department, or application where it started.

Our Solution
Userlane is a software adoption platform that works inside browser-based applications. For department goal alignment, it connects application adoption data to organizational targets across every system in the portfolio.
Setting measurable goals tied to application workflows
Goals lets clinical and operational leaders set targets that track automatically against application usage data. A medication safety goal tracks the share of MAR entries completed correctly. A procurement efficiency goal tracks requisition completion rates. Each goal is tied to the workflow where the outcome is produced, not to a self-reported survey or a manual audit.
Seeing adoption across the application portfolio
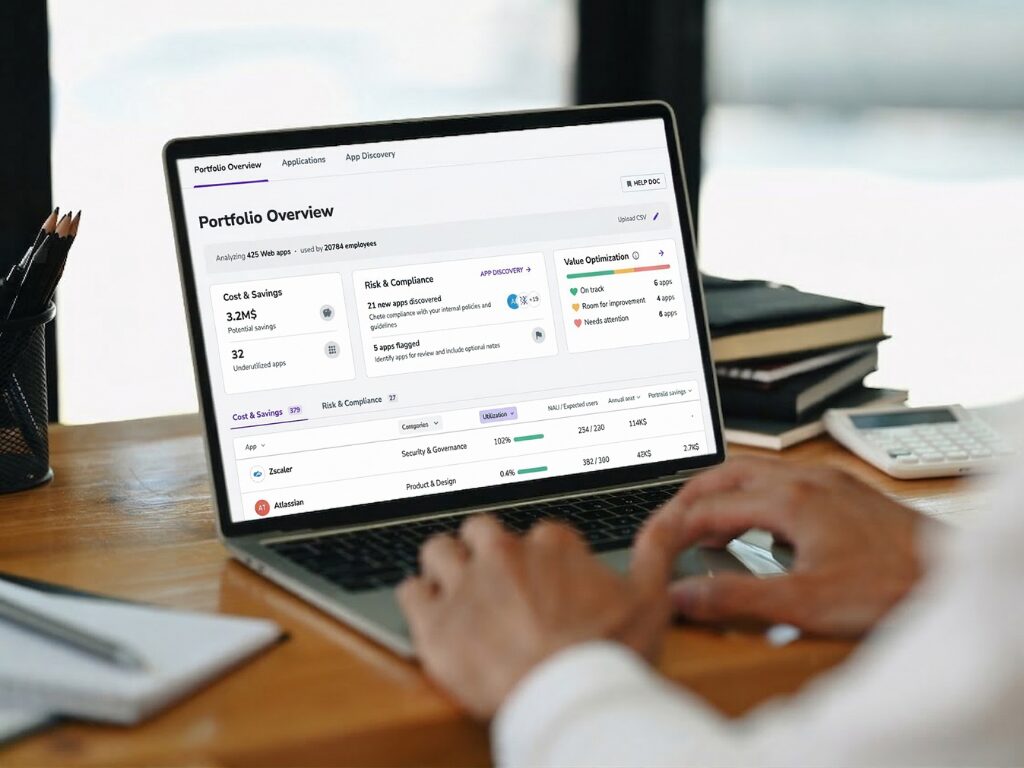
Portfolio Overview shows application health across every browser-based system in the organization: EHR, HRIS, ERP, quality management, and any other web application staff use. The view breaks down by department, application, and workflow, so leaders see where adoption supports their goals and where it falls short.
Measuring workflow health across departments
The HEART Score, Userlane’s application health metric, puts a single number on each workflow’s health. Department heads see their own scores. The executive team sees the organization-wide view. When a goal is missed, the HEART Score traces the gap back to the department, workflow, and staff segment where it started.
Measure. Act. Prove.
Every deployment follows the same cycle. Measurement comes first, intervention second, proof third. The cycle repeats with each new workflow.
Measure
Userlane records application usage across the portfolio before any intervention starts. The data shows where adoption gaps threaten organizational goals, so the leadership team acts on evidence, not assumptions.
The HEART Score maps the portfolio. Every application in the portfolio is measured: which workflows run smoothly, which have high error rates, where departments diverge from the organizational average. Nothing changes for the staff. The applications work exactly as before.
A pattern emerges. The EHR shows strong adoption in surgical departments but weak medication documentation on two medical wards. The ERP requisition workflow runs at 90% completion in facilities management but 60% in clinical departments. The HRIS timekeeping module has consistent gaps in the emergency department across all shifts. Portfolio Overview puts the full picture on one screen.
The team sees the real problem. Not “we need more training across the board.” Three departments need help with specific workflows in specific applications. The intervention writes itself.
Act
Validators, in-app guidance, and Goals deploy only where the measurement found gaps. Targeting the intervention is what makes the result provable.
Goals connect targets to workflows. Each organizational goal links to the application workflow that produces it. A medication safety target tracks MAR completion. A procurement target tracks requisition accuracy. Progress updates automatically from live usage data.
Support targets the gap. Validators and in-app guidance deploy in the specific applications and departments where adoption fell short. Clinical departments struggling with ERP requisitions get contextual help inside the procurement workflow. Medical wards with medication documentation gaps get Validators in the EHR. Departments already meeting targets see no change.
The intervention stays proportional. High-gap departments get support. High-performing departments are left alone. The executive team sees progress against each goal without waiting for the quarterly review.
Prove
The same measurement that found the problem now tracks whether the fix worked. Rising adoption scores, confirmed against the organization’s own performance data, close the loop.
The HEART Score moves. Portfolio Overview shows the change across every application and department. Individual Goals show progress against each organizational target. The executive team sees both views.
Results track against the target. The goals the leadership team set before the intervention track automatically. The quarterly review gets a before-and-after built from live data, not a separate report.
The cycle starts over. A new organizational priority is set. A system upgrade changes a workflow. A department reorganization shifts staff across units. The HEART Score flags the impact. Measure, act, prove runs again. The infrastructure is already there.
Proven Impact
When Goals and Portfolio Overview replace manual audits and self-reported surveys for department goal tracking, the results show in the health system’s own data: faster identification of adoption gaps, lower support volume from departments struggling with application workflows, and shorter time from goal-setting to measurable progress.
Up to 97%
Task completion rate across enterprise deployments
Up to 75%
Reduction in training time for new staff
Up to 48%
Fewer support requests after deployment
Up to 60%
Lower training costs vs. classroom methods
Frequently Asked Questions

