

The spending keeps climbing, the measurement hasn’t kept up
CIOs all over the world have approved record software budgets in 2025, and they are doing it again in 2026. The question none of the dashboards answer: does any of it change how people work?
Gartner’s April 2026 forecast projects global IT spending at $6.31 trillion in 2026, up 13.5% year over year. Software is the fastest-growing segment at $1.44 trillion, growing 15.1%. More tools, more AI, more vendor price increases on existing contracts. The investment case is clear, however, the evidence that it pays off is not.
McKinsey’s 2025 State of AI survey found that 88% of organizations now use AI in at least one business function, yet only 39% can attribute any enterprise-level EBIT impact. Just 6% qualify as high performers. A subsequent McKinsey analysis of the same data put it more starkly: 94% of respondents report not seeing significant value from their AI investments. The software shipped, but did the value follow?
The problem is adoption, not procurement. And for CIOs, it starts with the fact that the standard metrics (logins, training completions, satisfaction surveys) do not measure what the CFO’s scorecard requires: cost reduction, productivity gains, risk mitigation, and speed to value. Here’s why.
Why standard adoption metrics often mislead
The typical IT organization tracks three numbers: how many people logged in, how many completed training, and what the latest satisfaction survey returned. The problem is that these metrics describe activity, not outcomes.
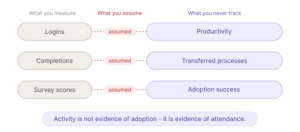
A login proves someone opened the application. Training completion proves someone sat through a course. These metrics say very little about whether an employee completed a task, avoided an error, or produced a result the organization paid for.
Peer-reviewed research on learning transfer confirms the structural problem: formal training is considered particularly ineffective for transfer because knowledge delivered outside the job context decays faster than it can be applied. The forgetting curve, replicated in modern controlled conditions, shows steep memory decline within days of learning. “Training completed” is not evidence that capability was retained.
The pattern holds at scale as well. Gartner’s CIO Agenda 2026 research, surveying over 2 thousand CIOs and technology executives, found that only 48% of digital initiatives meet or exceed business targets. Foundry’s 25th annual State of the CIO survey echoes this: only 19% of respondents say AI initiatives have met or exceeded business goals, and 32% cite ill-defined ROI metrics as a primary barrier to scaling.
The disconnect runs deeper than dashboards. When information officers present login counts to the board, they are speaking a language that financial officers do not use. The CFO tracks cost reduction, productivity, risk, and speed. If adoption metrics do not map to those categories, they do not earn a seat in the budget conversation.
What outcome-based adoption measurement looks like?
The shift from “how many people used the software” to “did the software produce the business result it was purchased for” is the goal of measurable adoption. Userlane does that by measuring 5 versatile dimensions and asking the following questions:
- Happiness: Are users completing tasks without friction, or are they abandoning workflows and calling the help desk?
- Engagement: Which features are actively used, and which were purchased but never adopted?
- Adoption: What percentage of provisioned users are doing meaningful work inside the application, not just logging in?
- Retention: Do users return to the application consistently, or does usage drop after initial onboarding?
- Task success: Are people completing the workflows the software was purchased to support, correctly and consistently?
Together, these dimensions create the HEART framework. Measured together, they produce a composite picture that no single metric can, providing better, in-depth visibility and actionable insights. High engagement with low task success suggests the software is being used but not effectively. High adoption with low retention suggests onboarding worked but ongoing support did not. Each combination points to a different intervention: retrain a specific team, redesign a workflow, reallocate a budget line.
The AI layer compounds the problem
AI deployments are compounding every challenge described in the sections above. Organizations are purchasing AI tools at scale without the measurement infrastructure to determine whether they deliver value.
Shadow AI makes the visibility gap worse. Verizon’s 2026 Data Breach Investigations Report found that 45% of employees are now regular AI users on corporate devices, up from 15% a year earlier, and that 67% access AI services through non-corporate accounts. Shadow AI is now the third most common non-malicious insider action detected in enterprise environments, a fourfold increase from the previous year.
For CIOs, the implication is straightforward: the software estate now includes AI tools that were never procured, never provisioned, and never measured. You cannot govern what you cannot see.
How Userlane approaches the problem
Userlane treats adoption as a measurement and assistance system that runs across the entire application estate. The platform operates across two integrated pillars.
Application Intelligence is the analytics layer. First, App Discovery maps which applications and browser-based AI services people actually use, including tools that were never sanctioned. Then, HEART Framework scores each application across the five adoption dimensions, producing per-app and per-segment scorecards that connect usage data to business outcomes. Lastly, Portfolio Overview rolls those scores up across the entire estate so CIOs can see which applications earn their budget and where spend can be redirected.
Contextual Assistance is the action layer. Once the Intelligence layer has identified friction (low task success in a specific workflow, a team struggling after a software update, a compliance process with high error rates), Interactive Guidance delivers the right help where the friction exists. Workflow help, automated step-by-step support, and targeted communications reach users at the moment they need them.
The two pillars run as a closed loop: measure where adoption falls short, fix it with targeted assistance, then prove the outcome changed.
So, where should you start?
Start by auditing what you already have. The data to identify underutilized software typically exists in fragments across procurement, IT service management, and HR systems. What is missing is the connection between those fragments and a consistent measurement framework.
Three questions to ask before the next budget cycle:
- For each major application, can you state the business outcome it was purchased to deliver?
- Can you measure whether that outcome materialized, using data that maps to the CFO’s scorecard?
- When adoption falls short, do you know why (and for whom) before the renewal conversation?
If the answer to any of these is no, the adoption strategy is flying without instruments, the software estate will keep growing, and the question is whether the CIO can prove it works.
Read more on accelerating software adoption here:
What enterprise software adoption metrics actually measure
Shadow AI: how to see which AI tools your teams actually use

